Optimizing multi-agent systems
Performance & Costs with ADOT, OpenTelemetry, X-Ray, and CloudWatch for AI Developers
You have deployed a multi-agent system:
- An orchestrator agent on Amazon AgentCore Runtime
- Subagents in AgentCore Runtime, EKS, and another cloud provider
- Tools on Lambda behind AgentCore Gateway; MCP servers on EC2
- Multiple models across the system.
Everything works, until it doesn’t: A user reports that the agent “took forever” on Tuesday. Another says it “gave the wrong answer.” You open CloudWatch. You see logs. Your CFO is pinging you “why are we spending so much money on this platform?”. In short, you are trying to figure out:
What are my users doing? Which steps, which agents, which invocation are breaking? What can be optimized?
This post introduces the Agentic observability stack that answers that question: AWS offers a full set of tools to help you develop new agentic systems, monitor them and diagnose errors. We will introduce OpenTelemetry, ADOT, X-Ray and CloudWatch composite metrics. With code.
The Mental Model: Three Layers
The foundation is the OpenTelemetry (OTEL) standard for telemetry that has 3 signal types: traces, metrics, and logs. It defines how observability data is generated, structured, and transmitted. It’s vendor-neutral, so it can be thought of the common language that everyone agrees to speak.
- A trace is the full path of request through your distributed system, represented as a tree of spans (each span corresponds to one operation, such as “invoked model”, “called tool” or “retrieved memory”). Traces help you understand what happened, in what order and how long each step took.
- A metric is a numerical measurement: token count per invocation, latency per request, error count per minute. Metrics are aggregated over time windows and help answer how your system is performing overall.
- A log is a timestamped record: the full prompt, the raw model response, an error stack trace, a guardrail violation. This is what helps you understand what exactly happened at a specific point in time.
The second layer is ADOT (AWS Distro for OpenTelemetry): This is AWS’s packaged distribution of OTEL that bundles the SDK, AWS-specific trace ID generators, context propagators, and exporters for AWS services. ADOT is OTEL pre-configured for AWS.
And finally we need a place in which the data lands and gets visualized: X-Ray stores and visualizes distributed traces; CloudWatch stores metrics and logs and provides dashboards.
You instrument your system with ADOT (which implements OTEL). Traces flow to X-Ray via CloudWatch as structured logs. Metrics and logs flow to CloudWatch. You read everything in the CloudWatch console, including the GenAI Observability page purpose-built for agents.
Sessions, Traces, Spans and Metrics
Let’s zoom into traces, because this is where multi-agent systems get interesting. Every interaction with your agent system produces a trace: a tree of operations that shows exactly what happened.
Session: user-abc-2026-05-28
│
├─ Trace: 1-684dff3a-abc123   (user asks: "find genes related to BRCA1 and enrich pathways")
│  │
│  ├─ Span: Orchestrator Agent [ROOT]                    2400ms
│  │   └─ attributes: session.id, agent.name="orchestrator"
│  │
│  ├─ Span: Model Invoke (Claude Sonnet)                  800ms
│  │   └─ attributes: model_id, input_tokens=1200, output_tokens=340
│  │
│  ├─ Span: Sub-Agent Call → Research Agent (AgentCore)    1100ms
│  │   │   └─ attributes: agent.name="research-agent"
│  │   │
│  │   ├─ Span: Model Invoke (Haiku)                       400ms
│  │   │   └─ attributes: input_tokens=800, output_tokens=120
│  │   │
│  │   └─ Span: Tool Call → PubMed MCP Server              600ms
│  │       └─ attributes: tool.name="search_pubmed"
│  │
│  └─ Span: Tool Call → Gateway → Enrichment Lambda        450ms
│      └─ attributes: tool.name="pathway_enrichment", tool.status="success"
│
└─ Trace: 1-684dff3a-def456   (user follow-up: "summarize the top 5 pathways")
   │
   └─ Span: Orchestrator Agent [ROOT]                     900ms
       ├─ Span: Memory Retrieval                           80ms
       └─ Span: Model Invoke (Claude Sonnet)              750ms
- A session groups multiple user turns into one conversation
- A trace is one request-response cycle (one agent invocation)
- A span is one unit of work inside that trace (one model call, one tool execution)
Spans nest: a sub-agent call is a parent span that contains its own child spans (model invokes, tool calls). This is how the full tree is reconstructed across service boundaries.
Looking at this trace, you can immediately see that the Research Agent’s PubMed MCP call took 600ms (25% of total latency), and the orchestrator used Sonnet where Haiku might suffice. These are potential optimization targets for your system.
Metrics like token count and latency are recorded as attributes on individual spans (visible when you inspect a trace in X-Ray) and also emitted as aggregated CloudWatch Metrics (visible in dashboards over time). Logs (such as the full model response) can be attached to specific spans. You can aggregate multiple interactions and visualize patterns: This where CloudWatch Dashboards come in, more on this later.
Generating Traces
Let’s go back to the multi-agent system that we introduced in the introduction: Agents deployed on AgentCore Runtime, Lambda tools behind AgentCore Gateways, MCP Servers on EC2, Subagents on EKS and other cloud providers. How do you actually produce traces from all these components? Let’s start with the hardest case: an agent or service running outside of AWS managed boundaries:
The General Case: Agent on EKS, another Cloud or On-Premise
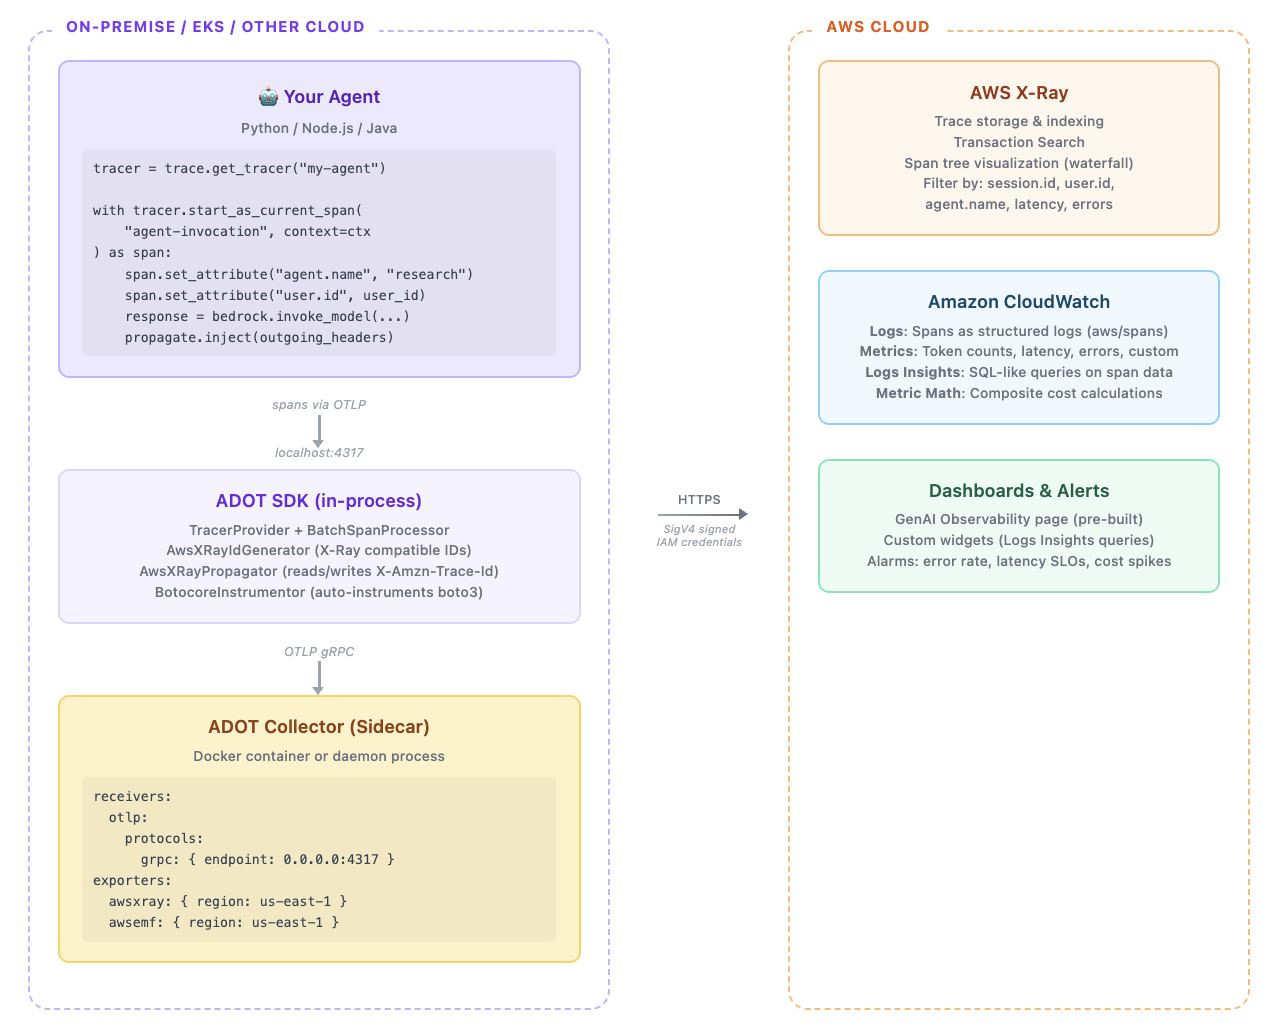
When you host an agent or tool outside of AWS managed services, you need to set up the observability stack yourself, this means you need to
- set up the ADOT SDK with the X-Ray ID generator and propagator;
- extract the incoming trace context from whoever calls your systems
- create spans for the work you do
- propagate trace context to anything you call downstream
and finally run an ADOT collector to export the spans to one central X-ray in CloudWatch. The critical piece is to connect the spans of your agent and tools with the incoming trace. Without it, your Agent or MCP server’s work would appear as an isolated trace, disconnected from the orchestrator that called it. More on this in the section on Trace Context Propagation.
In code:
from opentelemetry import trace, propagate
from opentelemetry.sdk.trace import TracerProvider
from opentelemetry.sdk.trace.export import BatchSpanProcessor
from opentelemetry.exporter.otlp.proto.grpc.trace_exporter import OTLPSpanExporter
from opentelemetry.sdk.extension.aws.trace import AwsXRayIdGenerator
from opentelemetry.propagators.aws import AwsXRayPropagator
from opentelemetry.instrumentation.botocore import BotocoreInstrumentor

# 1. One-time setup: TracerProvider + X-Ray propagator
provider = TracerProvider(
    active_span_processor=BatchSpanProcessor(
        OTLPSpanExporter(endpoint="http://localhost:4317")  # ADOT Collector sidecar
    ),
    id_generator=AwsXRayIdGenerator()  # Generates X-Ray compatible trace IDs
)
trace.set_tracer_provider(provider)
propagate.set_global_textmap(AwsXRayPropagator())  # Propagates X-Amzn-Trace-Id header
BotocoreInstrumentor().instrument()  # Auto-instruments boto3 calls

# 2. Your agent/tool code
tracer = trace.get_tracer("research-subagent")

def handle_request(user_input, incoming_headers):
    # Extract trace context from the orchestrator's call
    ctx = propagate.extract(incoming_headers)

    with tracer.start_as_current_span("research-agent-invocation", context=ctx) as span:
        span.set_attribute("agent.name", "research-agent")
        span.set_attribute("gen_ai.user.message", user_input)

        # Call Bedrock (auto-instrumented by BotocoreInstrumentor)
        response = bedrock_client.invoke_model(...)

        # Call PubMed MCP tool — propagate context downstream
        with tracer.start_as_current_span("tool-call-pubmed"):
            headers = {}
            propagate.inject(headers)  # Injects X-Amzn-Trace-Id into outgoing headers
            result = requests.post("http://pubmed-mcp:8080/tool",
                                   headers=headers, json={"query": "BRCA1"})

        return format_response(response, result)
Key pieces:
AwsXRayIdGenerator()ensures trace IDs are in X-Ray’s expected formatAwsXRayPropagator()handles reading and writing theX-Amzn-Trace-Idheaderpropagate.extract(incoming_headers)links your span to the parent tracepropagate.inject(headers)passes trace context to anything you call downstream
You also need to run the ADOT Collector as a sidecar, to receive your spans and export them to X-Ray. That’s a lot of setup for each component. Now imagine doing this for every agent, every MCP server, every service in your system. It adds up.
MCP Server on EC2: Same Pattern, Simpler Code
For a tool (not an agent), the code is lighter since you only receive requests and return results. You still need the ADOT Collector, but the instrumentation is minimal:
from opentelemetry import trace
from opentelemetry.propagate import extract

tracer = trace.get_tracer("pubmed-mcp-server")

def handle_tool_call(request):
    # Read the trace header from the incoming request
    context = extract(request.headers)

    # Create a child span linked to the caller's trace
    with tracer.start_as_current_span("search_pubmed", context=context) as span:
        span.set_attribute("tool.name", "search_pubmed")
        span.set_attribute("query.terms", request.json["query"])
        result = query_pubmed(request.json["query"])
        span.set_attribute("result.count", len(result))
        return result
Lambda Behind Gateway: One Config Change
Lambda simplifies things. Add the ADOT Lambda Layer and one environment variable:
# No code changes needed.
AWS_LAMBDA_EXEC_WRAPPER=/opt/otel-instrument
The layer bundles the OTEL SDK, auto-instrumentation for boto3/requests, and a mini ADOT Collector as a Lambda Extension. All outgoing calls become spans automatically. No TracerProvider setup, no Collector sidecar, no extract() calls. Lambda receives trace context automatically via X-Ray Active Tracing.
AgentCore Runtime: It’s All Done For You
When you host your agent on AgentCore Runtime, all of the setup above disappears. ADOT is pre-configured. The Collector is built in. Trace context is propagated automatically to any tool you call through AgentCore Gateway.
How X-Ray Assembles the Full Picture - Trace Context Propagation
Your orchestrator, Lambda, MCP server, and EKS subagent all produced spans independently, potentially running on different machines, different accounts, even different clouds. How does X-Ray know they all belong to the same user request?
Every request in the chain carries a header like called the Trace Context
X-Amzn-Trace-Id: Root=1-67890abc-def012345678; Parent=53995c3f42cd8ad8; Sampled=1
Root = the trace ID (same across ALL services in one request) Parent = the span ID of the caller (creates the parent→child hierarchy) Sampled = whether to record this trace
When the orchestrator calls the Research Agent, it injects this header. The Research Agent reads it, creates a child span under that parent, and passes the same Root + its own span ID to the PubMed MCP server. That server does the same. Every hop passes the baton. X-Ray simply collects all spans that share the same Root trace ID and reconstructs the tree.
X-Ray sees one trace with all these spans, regardless of where they ran. In the CloudWatch console, you click into a trace and see the full tree — with latency per span, error status, and all attributes.
Viewing a trace in practice in the AWS Console
To inspect a specific request, open CloudWatch Console → X-Ray traces → Transaction Search. You can filter by time range, session ID, agent name, error status, latency threshold, or any custom span attribute you’ve defined.
Click any trace to see the full span tree in a waterfall view: each span shows its duration as a timing bar, with parent-child nesting visible. Click a specific span to inspect all its attributes (token counts, tool name, model ID, error details, custom attributes like user.id or use_case).
One note: full prompt/response text is only visible if you explicitly set it as a span attribute or event. Storing full prompts in every span is expensive and may have PII implications, so this is an intentional choice you make per use case.
CloudWatch Dashboards — Aggregating Across Traces
Traces are great for debugging a single request. But your CFO’s question (“why are we spending so much?”) and your goal of identifying optimization opportunities require aggregated views across thousands of traces. This is what CloudWatch Dashboards provide.
Default Metrics (No Code Changes)
AgentCore and Bedrock emit metrics automatically:
| Metric | What it tells you |
|---|---|
InvocationCount |
How many times each agent/model was called |
InvocationLatency |
How long each call took (p50, p95, p99) |
InputTokenCount / OutputTokenCount |
Token consumption per model |
ErrorCount |
Failures per agent or tool |
SessionCount |
Number of active user sessions |
These are filterable by dimensions like AgentId, ModelId, ToolName, and GatewayId.
The GenAI Observability Page (Pre-Built)
Before building custom dashboards, start here: CloudWatch Console → Application Signals → GenAI Observability. This page auto-populates with your agent IDs, model IDs, session IDs, and tool names as dropdown filters. You get trace visualizations, token usage graphs, latency breakdowns, and error rates out of the box.
For multi-agent systems, the page shows metrics for each agent that reports through ADOT. If your orchestrator and subagents all run on AgentCore Runtime, they appear as separate agents in the dashboard. If some agents run externally (EKS, on-prem), they appear too, as long as they emit spans to X-Ray with the proper attributes.
Custom Span Attributes: Making Dashboards Meaningful
The default metrics are useful, but they don’t answer questions like “which user is driving cost?” or “which use case has the worst latency?”. For that, you need custom attributes on your spans that become queryable dimensions.
When you define trace_attributes in your agent (or span.set_attribute() in manual instrumentation), those attributes get stored with the span data. You can then query them with Logs Insights in CloudWatch:
-- Find the 10 slowest sessions in the past 24 hours
fields @timestamp, session.id, @duration
| filter agent.name = "orchestrator"
| sort @duration desc
| limit 10
-- Token usage grouped by user
fields session.id, gen_ai.usage.input_tokens, gen_ai.usage.output_tokens
| stats sum(gen_ai.usage.input_tokens) as total_input,
        sum(gen_ai.usage.output_tokens) as total_output
  by session.id
| sort total_output desc
-- Error rate per tool
fields tool.name, tool.status
| filter tool.status = "error"
| stats count() as error_count by tool.name
| sort error_count desc
Custom Metrics: Emitting Your Own Numbers
Beyond querying span attributes, you can emit your own CloudWatch Metrics from within your agent code. This is useful for business-level metrics that don’t exist in the default set:
from opentelemetry import metrics

meter = metrics.get_meter("my-agent-metrics")

# Custom counters
cost_counter = meter.create_counter(
    name="genai.estimated_cost_usd",
    description="Estimated cost in USD",
    unit="dollars"
)

# Record after each invocation
def record_cost(model_id, input_tokens, output_tokens):
    # Your pricing logic
    cost = (input_tokens * 0.003 / 1000) + (output_tokens * 0.015 / 1000)
    cost_counter.add(cost, {
        "model": model_id,
        "agent.name": "orchestrator",
        "environment": "production"
    })
These custom metrics flow through ADOT to CloudWatch Metrics, where you can graph them, set alarms, and build dashboards.
Identifying Power Users
A session ID alone doesn’t tell you who is driving cost. You need to tie traces to an identity. If your app authenticates users via Amazon Cognito (or any IdP), extract the user identifier from the JWT token and pass it as a custom span attribute:
@app.entrypoint
async def invoke(payload, context):
    # Your app layer already validated the Cognito JWT
    user_id = payload.get("user_id")  # extracted from Cognito 'sub' claim

    agent = Agent(
        model=load_model(),
        trace_attributes={
            "session.id": context.get("session_id"),
            "user.id": user_id,              # ← This is the link
            "agent.name": "orchestrator",
        }
    )
Then in Logs Insights dashboard widget:
-- Top 10 users by token consumption (past 7 days)
fields user.id, gen_ai.usage.input_tokens, gen_ai.usage.output_tokens
| stats sum(gen_ai.usage.input_tokens) as input_total,
        sum(gen_ai.usage.output_tokens) as output_total,
        count() as invocation_count
  by user.id
| sort output_total desc
| limit 10
A privacy note: use the Cognito sub (a UUID) or a hashed identifier rather than raw email addresses in span attributes. Keep the mapping (hash → email) in a separate access-controlled store.
Grouping Traces by Use Case / Theme
Your multi-agent system likely serves different use cases: genomics research, literature review, safety signal detection. Grouping traces by theme lets you answer “which use case costs the most?” or “which use case has the worst latency?”
Option 1: Tag at ingestion time:
Classify the user’s intent at invocation time and attach it as a span attribute: One could use key-word classification or lite-weight LLM to classify intent
def classify_intent(user_message):
    message_lower = user_message.lower()
    if any(w in message_lower for w in ["gene", "brca", "pathway", "mutation"]):
        return "genomics_research"
    elif any(w in message_lower for w in ["adverse event", "safety", "pharmacovigilance"]):
        return "safety_signal"
    elif any(w in message_lower for w in ["summarize", "literature", "review"]):
        return "literature_review"
    return "general"

agent = Agent(
    trace_attributes={
        "use_case": classify_intent(user_message),  # ← Theme tag
        ...
    }
)
Then aggregate in Logs Insights:
-- Cost and volume breakdown by use case
fields use_case, gen_ai.usage.input_tokens, gen_ai.usage.output_tokens
| stats sum(gen_ai.usage.input_tokens) as input_total,
        sum(gen_ai.usage.output_tokens) as output_total,
        count() as invocations
  by use_case
| sort output_total desc
Option 2: Classify retroactively with Logs Insights regex (flexible, no pre-tagging needed):
If you didn’t tag at ingestion, you can still group using regex on the user message stored in the span:
fields gen_ai.user.message, gen_ai.usage.input_tokens, gen_ai.usage.output_tokens
| fields
    case(
      gen_ai.user.message like /(?i)(gene|pathway|brca|mutation|variant)/, "genomics",
      gen_ai.user.message like /(?i)(adverse|safety|pharmacovigilance|signal)/, "safety",
      gen_ai.user.message like /(?i)(summarize|literature|review|paper)/, "lit_review",
      1=1, "other"
    ) as use_case
| stats sum(gen_ai.usage.input_tokens + gen_ai.usage.output_tokens) as total_tokens,
        count() as trace_count
  by use_case
This requires the user message to be stored in the span (which it is if you set gen_ai.user.message as an attribute). For more sophisticated categorization where regex isn’t enough, you could run a fast model (Haiku) to classify the intent at invocation time, then emit the result as a metric dimension.
Querying Dashboard Data: Three Mechanisms
CloudWatch doesn’t use regex for dashboard widgets. Instead you have:
Search Expressions (token-based partial matching):
SEARCH('{bedrock-agentcore, AgentId} Latency', 'Average')
Searching research finds research-agent. Use "ExactMatch" for precise strings.
Metrics Insights (SQL-like, with wildcards):
SELECT AVG(InvocationLatency)
FROM "bedrock-agentcore"
WHERE AgentId LIKE '%research%'
GROUP BY AgentId
ORDER BY AVG(InvocationLatency) DESC
Logs Insights (full regex, for span-level data):
fields @timestamp, @message
| filter @message like /(?i)tool.*error/
| parse @message '"session.id":"*"' as session_id
| stats count() by bin(5m)
Putting It All Together
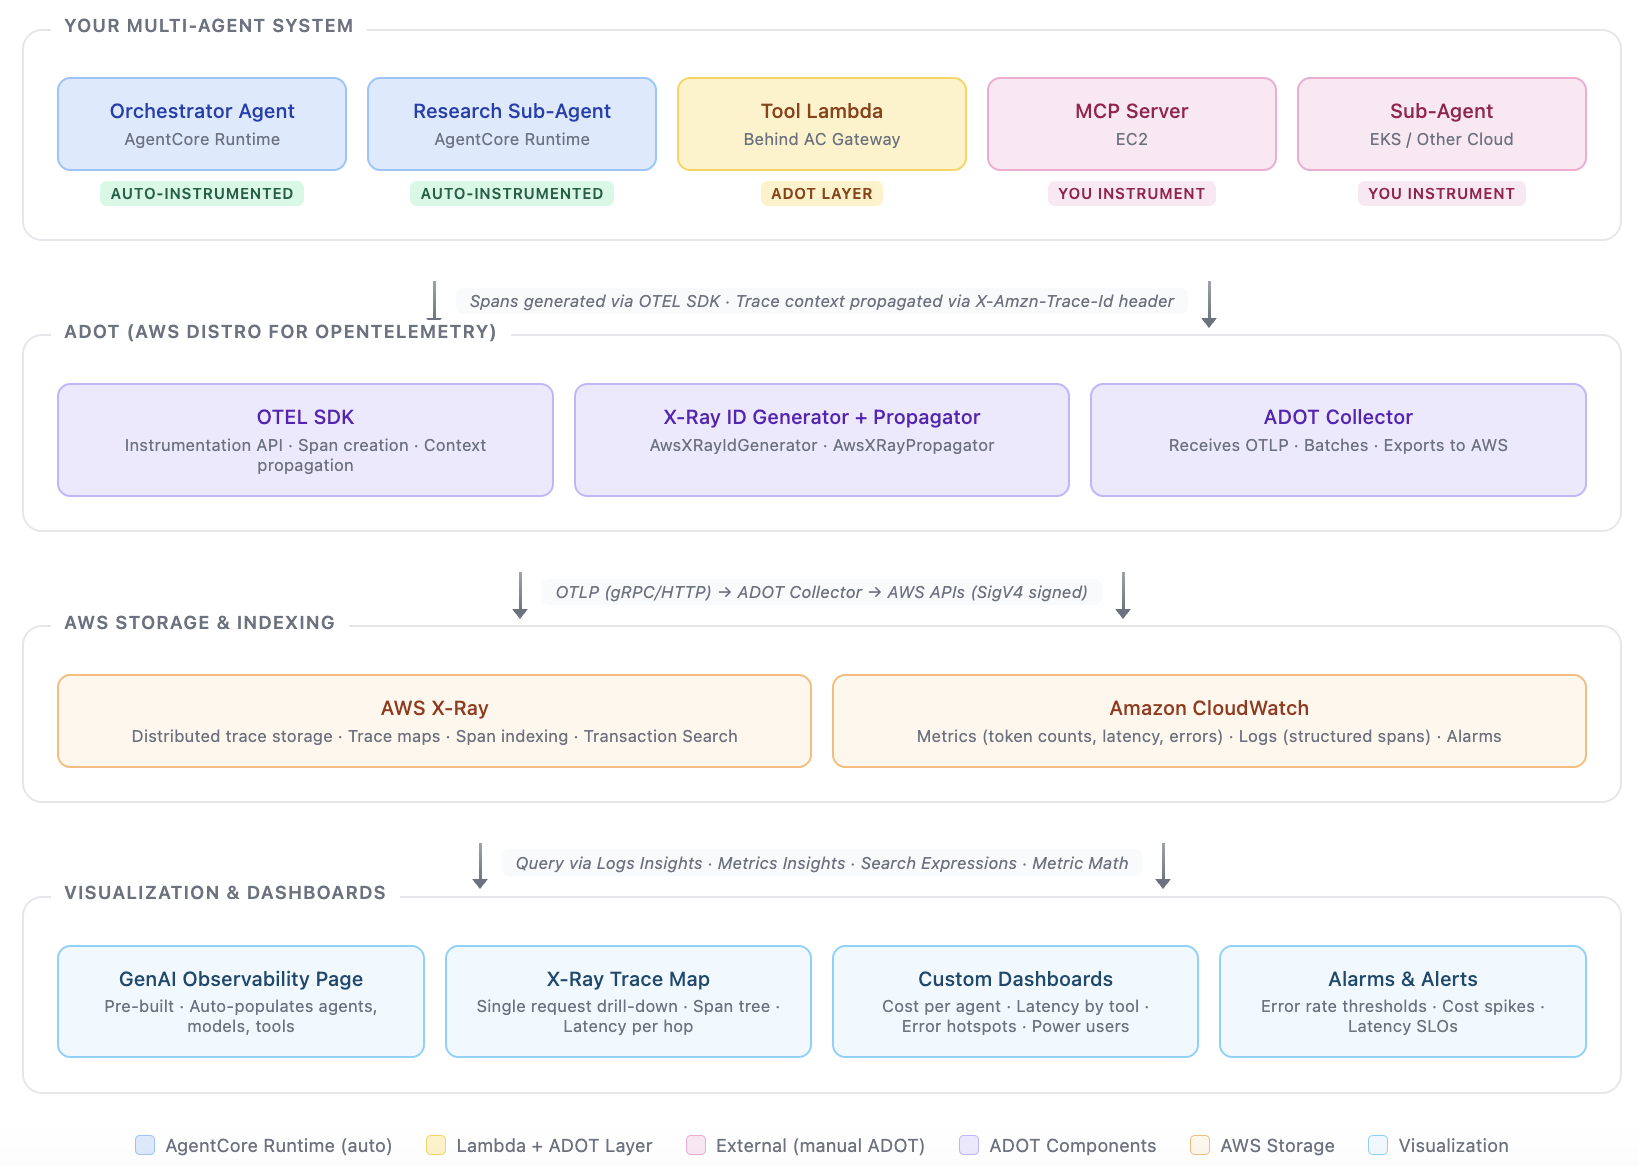
The observability flow for your multi-agent system:
-
Instrument: AgentCore Runtime and Gateway are automatic. Add the ADOT Lambda layer to your tools. Add
extract(headers)+ ADOT Collector to your MCP server and EKS subagent. -
Propagate: Every call passes
X-Amzn-Trace-Id. X-Ray assembles the tree. -
Debug individual requests: Open a trace in X-Ray to see exactly which span failed, which was slow, which consumed the most tokens.
-
Monitor aggregate patterns: Use the GenAI Observability page for out-of-the-box views, or build custom dashboards with Metric Math and Logs Insights for business-specific questions.
-
Optimize: Identify expensive model usage (Sonnet where Haiku suffices), slow tools, error-prone services, and power users driving cost.
The effort required scales with how much of your system is outside the managed AgentCore boundary. If everything runs on AgentCore Runtime + Gateway + Lambda, you get full observability with near-zero instrumentation. The more you run externally, the more ADOT setup you own.
⚠️ Note: As of February 2026, the legacy X-Ray SDK and Daemon entered maintenance mode. AWS recommends ADOT + OpenTelemetry for all new instrumentation. Don’t use aws-xray-sdk in new projects.