Monitoring your Kiro agent with OpenTelemetry
You’re building agents. You’re writing skills, wiring tools, tuning system prompts. But if you’re not measuring what the agent actually does at runtime — which skills fire, how long each tool takes, how many calls it makes per turn — you’re just guessing.
Every major agent harness now exposes capabilities as skills: markdown files with a description (when to activate) and a body (what to do). You have to choose your model, but you also have to pick your skills and tools. The performance-critical layer has moved from the model to the wrapper.
This post shows how I instrumented my Kiro agent with OpenTelemetry to produce X-Ray traces in CloudWatch — a waterfall view of every session, every tool call, every skill load. I want to see what the agent is actually doing, find where it’s slow or wrong, and get signal to improve its configuration.
What you’re optimizing
An agent session looks like this:
User prompt → Skill selection → Tool calls → Model reasoning → Response
Each stage has failure modes:
- Wrong skill activated (or none at all)
- Tool call took 4 seconds when it should take 200ms
- Model called 3 tools when 1 would have sufficed
- Skill loaded but instructions were too vague, producing a bad outcome
Without traces, you’re reading chat logs and squinting. With traces, you get a waterfall:
session                                    [========================] 12.4s
  ├─ user.prompt                           [=]
  ├─ skill.weekly-updates-to-sift          [==]                        1.2s
  ├─ tool.sharepoint_read_file             [====]                      2.1s
  ├─ tool.sharepoint_read_file             [===]                       1.8s
  ├─ tool.sift_insights_create             [=====]                     3.2s
  ├─ tool.sift_insights_create             [=====]                     2.9s
  └─ turn.complete                         [=]
SharePoint reads take 2 seconds each. SIFT creation takes 3 seconds. If I’m running 5 insights per session, that’s 15 seconds in SIFT alone. Worth batching? Worth caching the SharePoint reads? The trace tells me where to look.
Architecture
Kiro Agent (hooks) → curl → localhost:4318 → otelcol-contrib → X-Ray → CloudWatch
                                                              ↘ local .jsonl (backup)
Four components:
- A hook script (
otel-trace.sh) that fires on every lifecycle event and emits OTLP spans via curl - An OTEL Collector (otelcol-contrib) running locally, receiving spans on port 4318, enriching them with GenAI semantic conventions, and exporting to X-Ray
- CloudWatch Transaction Search configured to index traces
- Agent configuration wiring the hook to all 5 lifecycle events
The collector isn’t just a passthrough — it adds resource attributes that make your traces appear in CloudWatch’s GenAI Observability dashboard (the same UI used for production Bedrock AgentCore agents). You get the span timeline view for free.
The hook script
Kiro agents support hooks on 5 lifecycle events: agentSpawn, userPromptSubmit, preToolUse, postToolUse, stop. Each hook receives a JSON payload via STDIN with the event type and relevant context (tool name, tool input, response, etc).
I use a single bash script for all 5. The design decisions:
One trace per session. The trace ID is deterministic from KIRO_SESSION_ID: epoch timestamp (8 hex chars) concatenated with a SHA-256 hash of the session ID (24 hex chars). Every span in a session shares this trace ID, producing one waterfall per conversation.
Reset on spawn. When agentSpawn fires, the epoch file is overwritten — fresh trace even if the session ID is reused across agent restarts.
Pre/post pairing for duration. preToolUse saves the span ID and start time to a state file. postToolUse reads it back, computes real duration, emits the completed span. Accurate tool latencies, not point-in-time markers.
Skill detection. If a file read targets something in skills/, the span is named skill.<name> instead of tool.read. Skill loads become visible as distinct events in the waterfall.
Resource-level attributes. The script embeds service.name, aws.log.group.names, and session.id directly on each span’s resource. This is belt-and-suspenders with the collector’s processor enrichment — if the collector’s processors fail or get misconfigured, traces still route correctly.
Here’s the full script:
#!/bin/bash
# OTEL trace hook for Kiro → CloudWatch Application Signals (waterfall-ready)
# preToolUse saves start time; postToolUse closes the span with real duration

OTEL_ENDPOINT="http://localhost:4318"
OTEL_LOG_DIR="$HOME/.kiro/otel-traces"
STATE_DIR="$HOME/.kiro/otel-traces/state"
mkdir -p "$OTEL_LOG_DIR" "$STATE_DIR"

EVENT=$(cat)
HOOK_NAME=$(echo "$EVENT" | jq -r '.hook_event_name // "unknown"')
SESSION_ID="${KIRO_SESSION_ID:-unknown}"
NOW_NANO=$(python3 -c "import time; print(int(time.time()*1e9))")

# --- Stable trace ID per session ---
EPOCH_FILE="$STATE_DIR/${SESSION_ID}.epoch"
[ ! -f "$EPOCH_FILE" ] && printf '%08x' $(date +%s) > "$EPOCH_FILE"
EPOCH_HEX=$(cat "$EPOCH_FILE")
SESSION_HASH=$(echo -n "$SESSION_ID" | shasum -a 256 | cut -c1-24)
TRACE_ID="${EPOCH_HEX}${SESSION_HASH}"

# --- Root span tracking ---
ROOT_FILE="$STATE_DIR/${SESSION_ID}.root"
PARENT_SPAN_ID=""
[ -f "$ROOT_FILE" ] && PARENT_SPAN_ID=$(cat "$ROOT_FILE")

emit_span() {
  local SPAN_ID="$1" SPAN_NAME="$2" START="$3" END="$4" ATTRS="$5" PARENT="$6"
  local PARENT_FIELD=""
  [ -n "$PARENT" ] && PARENT_FIELD="\"parentSpanId\": \"$PARENT\","

  echo "{\"ts\":$START,\"trace\":\"$TRACE_ID\",\"span\":\"$SPAN_NAME\",\"session\":\"$SESSION_ID\"}" \
    >> "$OTEL_LOG_DIR/traces-$(date +%Y-%m-%d).jsonl"

  curl -s -X POST "$OTEL_ENDPOINT/v1/traces" \
    -H "Content-Type: application/json" \
    -d "{
      \"resourceSpans\": [{
        \"resource\": {\"attributes\": [
          {\"key\": \"service.name\", \"value\": {\"stringValue\": \"kiro-jarvis\"}},
          {\"key\": \"aws.log.group.names\", \"value\": {\"stringValue\": \"/aws/bedrock-agentcore/runtimes/kiro-jarvis\"}},
          {\"key\": \"session.id\", \"value\": {\"stringValue\": \"$SESSION_ID\"}}
        ]},
        \"scopeSpans\": [{
          \"scope\": {\"name\": \"kiro-hooks\"},
          \"spans\": [{
            \"traceId\": \"$TRACE_ID\",
            \"spanId\": \"$SPAN_ID\",
            $PARENT_FIELD
            \"name\": \"$SPAN_NAME\",
            \"kind\": 1,
            \"startTimeUnixNano\": \"$START\",
            \"endTimeUnixNano\": \"$END\",
            \"attributes\": $ATTRS,
            \"status\": {\"code\": 1}
          }]
        }]
      }]
    }" > /dev/null 2>&1
}

case "$HOOK_NAME" in
  agentSpawn)
    # Reset trace ID for new session
    printf '%08x' $(date +%s) > "$EPOCH_FILE"
    EPOCH_HEX=$(cat "$EPOCH_FILE")
    TRACE_ID="${EPOCH_HEX}${SESSION_HASH}"

    SPAN_ID=$(python3 -c "import secrets; print(secrets.token_hex(8))")
    echo "$SPAN_ID" > "$ROOT_FILE"
    echo "$NOW_NANO" > "$STATE_DIR/${SESSION_ID}.root_start"
    # Emit a marker so the trace exists immediately
    emit_span "$SPAN_ID" "session" "$NOW_NANO" "$NOW_NANO" \
      '[{"key":"session.id","value":{"stringValue":"'"$SESSION_ID"'"}}]' "" &
    ;;

  userPromptSubmit)
    SPAN_ID=$(python3 -c "import secrets; print(secrets.token_hex(8))")
    PROMPT=$(echo "$EVENT" | jq -r '.prompt // ""' | head -c 200 | sed 's/"/\\"/g' | tr '\n' ' ')
    END=$(python3 -c "import time; print(int((time.time()+0.01)*1e9))")
    emit_span "$SPAN_ID" "user.prompt" "$NOW_NANO" "$END" \
      '[{"key":"prompt.preview","value":{"stringValue":"'"$PROMPT"'"}},{"key":"session.id","value":{"stringValue":"'"$SESSION_ID"'"}}]' \
      "$PARENT_SPAN_ID" &
    ;;

  preToolUse)
    TOOL=$(echo "$EVENT" | jq -r '.tool_name // "unknown"')
    SPAN_ID=$(python3 -c "import secrets; print(secrets.token_hex(8))")
    FILE_PATH=$(echo "$EVENT" | jq -r '.tool_input.operations[0].path // .tool_input.path // ""' 2>/dev/null)

    if [[ "$FILE_PATH" == *"SKILL.md"* ]] || [[ "$FILE_PATH" == *"skills/"* ]]; then
      SKILL_NAME=$(echo "$FILE_PATH" | sed -n 's|.*skills/\([^/]*\)/.*|\1|p')
      SPAN_NAME="skill.${SKILL_NAME:-unknown}"
    else
      SPAN_NAME="tool.${TOOL}"
    fi

    # Save state for postToolUse to close this span
    echo "${SPAN_ID}|${NOW_NANO}|${SPAN_NAME}|${TOOL}" > "$STATE_DIR/${SESSION_ID}.pending_tool"
    ;;

  postToolUse)
    PENDING_FILE="$STATE_DIR/${SESSION_ID}.pending_tool"
    if [ -f "$PENDING_FILE" ]; then
      IFS='|' read -r SPAN_ID START_NANO SPAN_NAME TOOL < "$PENDING_FILE"
      rm -f "$PENDING_FILE"

      SUCCESS=$(echo "$EVENT" | jq -r '.tool_response.success // "unknown"')
      DURATION_MS=$(python3 -c "print(round(($NOW_NANO - $START_NANO) / 1e6, 1))")

      emit_span "$SPAN_ID" "$SPAN_NAME" "$START_NANO" "$NOW_NANO" \
        '[{"key":"tool.name","value":{"stringValue":"'"$TOOL"'"}},{"key":"tool.success","value":{"stringValue":"'"$SUCCESS"'"}},{"key":"duration_ms","value":{"doubleValue":'"$DURATION_MS"'}},{"key":"session.id","value":{"stringValue":"'"$SESSION_ID"'"}}]' \
        "$PARENT_SPAN_ID" &
    fi
    ;;

  stop)
    SPAN_ID=$(python3 -c "import secrets; print(secrets.token_hex(8))")
    RESPONSE_LEN=$(echo "$EVENT" | jq -r '.assistant_response // ""' | wc -c | tr -d ' ')
    END=$(python3 -c "import time; print(int((time.time()+0.01)*1e9))")
    emit_span "$SPAN_ID" "turn.complete" "$NOW_NANO" "$END" \
      '[{"key":"response.length","value":{"intValue":"'"$RESPONSE_LEN"'"}},{"key":"session.id","value":{"stringValue":"'"$SESSION_ID"'"}}]' \
      "$PARENT_SPAN_ID" &

    # Re-emit root span with real end time for proper waterfall envelope
    if [ -f "$ROOT_FILE" ] && [ -f "$STATE_DIR/${SESSION_ID}.root_start" ]; then
      ROOT_SPAN=$(cat "$ROOT_FILE")
      ROOT_START=$(cat "$STATE_DIR/${SESSION_ID}.root_start")
      emit_span "$ROOT_SPAN" "session" "$ROOT_START" "$NOW_NANO" \
        '[{"key":"session.id","value":{"stringValue":"'"$SESSION_ID"'"}}]' "" &
    fi
    ;;
esac
Why not trace full prompts?
You’ll notice the hook only captures a 200-character preview of the user prompt — not the full text. This is intentional. Your prompts contain customer names, internal data, vault content, and tool outputs. Once that’s in X-Ray spans, it’s in CloudWatch logs at rest — data you can’t selectively redact later. The cost adds up too: full prompts run 2-50KB per turn, and at dozens of sessions per week that’s meaningful Logs ingestion for data you’ll rarely query. The 200-char preview tells you which user intent triggered the session; if you need the full prompt for debugging, it’s already in your local session .jsonl files. Trace the structure, not the content.
The collector
The OTEL Collector runs as a background process. It receives spans on port 4318, enriches them with GenAI semantic conventions (so they appear in CloudWatch’s AgentCore Observability dashboard), and exports to both X-Ray and a local backup file:
receivers:
  otlp:
    protocols:
      http:
        endpoint: 0.0.0.0:4318

processors:
  resource:
    attributes:
      - key: aws.log.group.names
        value: /aws/bedrock-agentcore/runtimes/kiro-jarvis
        action: upsert
      - key: cloud.resource_id
        value: arn:aws:bedrock-agentcore:us-west-2:YOUR_ACCOUNT_ID:runtime/kiro-jarvis
        action: upsert
      - key: aws.service.type
        value: gen_ai_agent
        action: upsert
  attributes:
    actions:
      - key: gen_ai.agent.name
        value: kiro-jarvis
        action: upsert
      - key: gen_ai.system
        value: aws.bedrock.agentcore
        action: upsert
      - key: gen_ai.session.id
        from_attribute: session.id
        action: upsert

exporters:
  otlphttp:
    endpoint: https://xray.us-west-2.amazonaws.com/v1/traces
    headers:
      x-aws-log-group: /aws/bedrock-agentcore/runtimes/kiro-jarvis
      x-aws-log-stream: runtime-logs
      x-aws-metric-namespace: bedrock-agentcore
    auth:
      authenticator: sigv4auth
  file:
    path: ~/.kiro/otel-traces/otel-spans.jsonl
    flush_interval: 1s

extensions:
  sigv4auth:
    region: us-west-2
    service: xray

service:
  extensions: [sigv4auth]
  pipelines:
    traces:
      receivers: [otlp]
      processors: [resource, attributes]
      exporters: [otlphttp, file]
Key details:
processors.resourceadds the log group name, a synthetic ARN, andaws.service.type: gen_ai_agent. CloudWatch’s GenAI Observability dashboard usesaws.log.group.namesto discover traces andaws.service.typeto classify them as agent workloads — without these, your spans show up in Transaction Search but not in the AgentCore tab.processors.attributescopiessession.idtogen_ai.session.idand sets the agent name and system. These are the GenAI semantic conventions that CloudWatch expects.otlphttpexporter withsigv4authsends traces directly to X-Ray’s OTLP endpoint using SigV4 authentication. This replaces the olderawsxrayexporter which doesn’t support all OTLP features and is being deprecated. Thesigv4authextension handles credential signing automatically from your environment or profile.- The
x-aws-*headers on the exporter ensure traces are associated with the correct log group and metric namespace in CloudWatch, enabling the GenAI dashboard to aggregate metrics across sessions. - The file exporter is a local backup — useful when credentials expire or you want to replay traces into a different backend.
To start the collector, I use a wrapper that validates AWS credentials and backgrounds the process:
#!/bin/bash
# start.sh — Start OTEL collector for Kiro tracing → X-Ray
pkill -f otelcol-contrib 2>/dev/null
sleep 1

# Set this to your AWS profile with X-Ray write permissions
PROFILE="your-aws-profile"

if ! aws sts get-caller-identity --profile "$PROFILE" > /dev/null 2>&1; then
  echo "ERROR: No valid AWS credentials for profile $PROFILE"
  exit 1
fi

echo "✓ Credentials OK (profile: $PROFILE)"

AWS_PROFILE="$PROFILE" nohup \
  ~/.kiro/otel-collector/otelcol-contrib --config ~/.kiro/otel-collector/config.yaml \
  > ~/.kiro/otel-collector/collector.log 2>&1 &

echo "✓ PID: $!"
sleep 2
if grep -q "error" ~/.kiro/otel-collector/collector.log; then
  echo "⚠ Errors in log:"
  grep "error" ~/.kiro/otel-collector/collector.log | tail -2
else
  echo "✓ Collector running, no errors"
fi
Install otelcol-contrib via brew install open-telemetry/opentelemetry-collector/otelcol-contrib, then run start.sh once per session. The sigv4auth extension in the collector config handles credential signing — it reads from the standard AWS credential chain (environment variables, ~/.aws/credentials, IAM roles). The startup script just validates that credentials exist before launching; if your session expires mid-run, spans fall through to the local .jsonl backup.
Agent configuration
The hook wires into all 5 lifecycle events:
{
  "hooks": {
    "agentSpawn": [
      { "command": "~/.kiro/hooks/otel-trace.sh", "timeout_ms": 3000 }
    ],
    "userPromptSubmit": [
      { "command": "~/.kiro/hooks/otel-trace.sh", "timeout_ms": 3000 }
    ],
    "preToolUse": [
      { "matcher": "*", "command": "~/.kiro/hooks/otel-trace.sh", "timeout_ms": 3000 }
    ],
    "postToolUse": [
      { "matcher": "*", "command": "~/.kiro/hooks/otel-trace.sh", "timeout_ms": 3000 }
    ],
    "stop": [
      { "command": "~/.kiro/hooks/otel-trace.sh", "timeout_ms": 3000 }
    ]
  }
}
matcher: "*" on pre/post tool hooks means every tool call gets traced. The 3-second timeout is tight enough that a failed collector doesn’t block the agent.
What the dashboard shows you
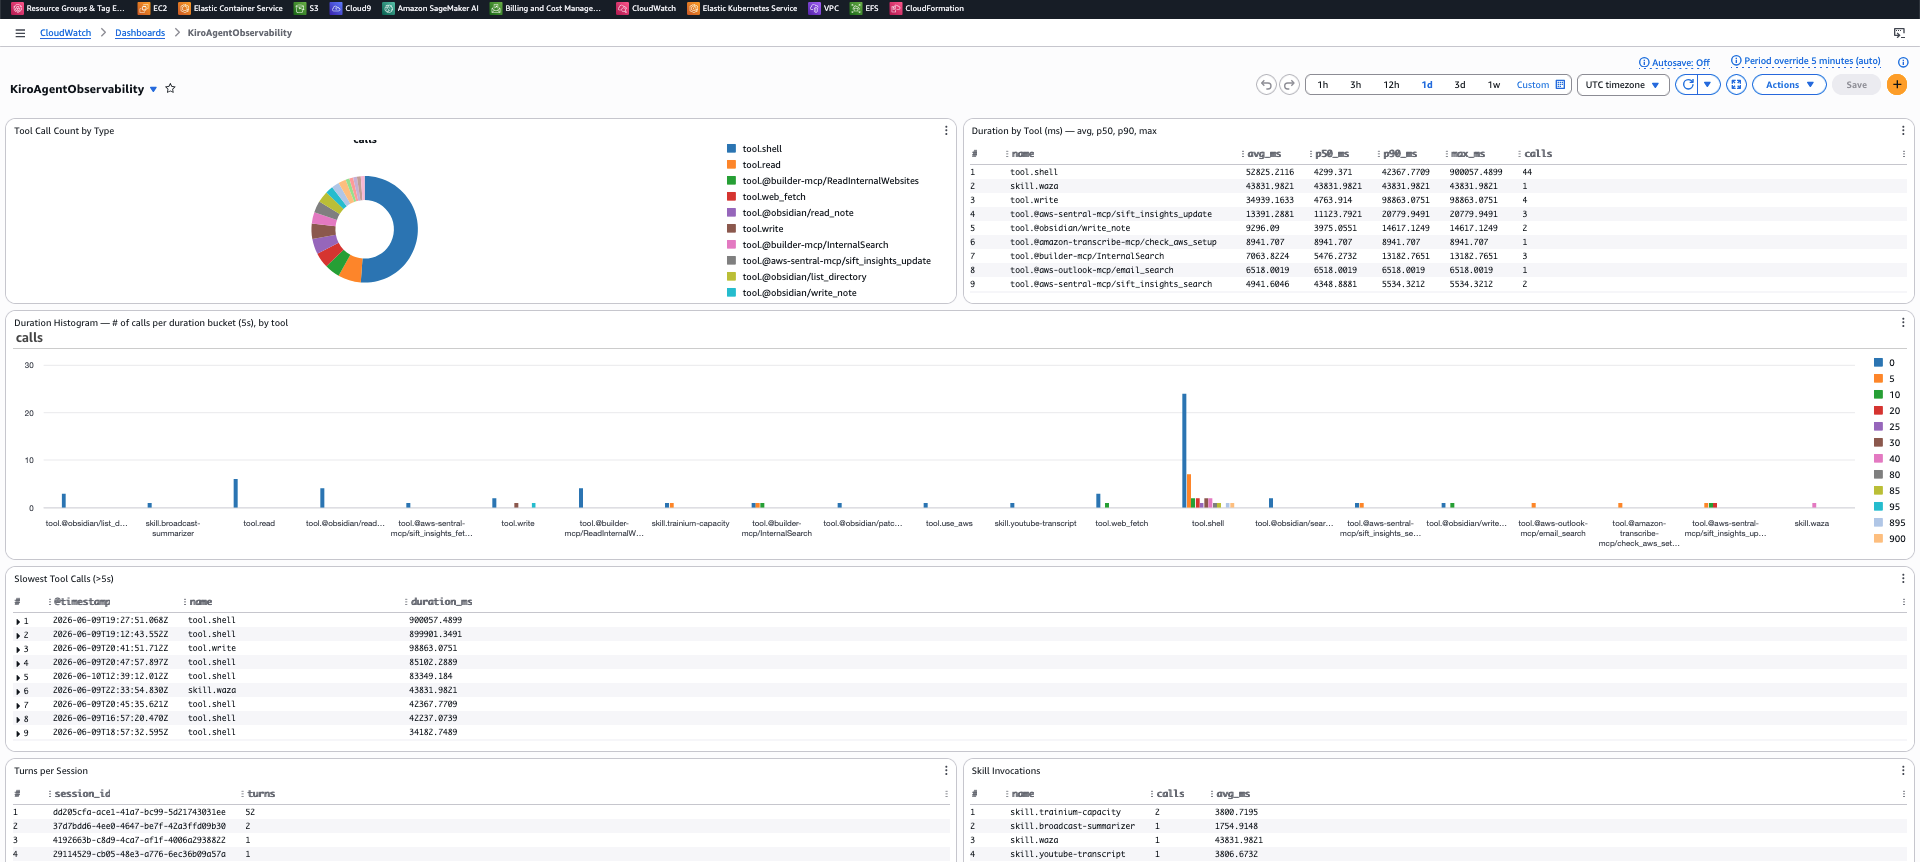
Each session appears as a single trace in CloudWatch Transaction Search. Expand it and you get the waterfall: skill loads, tool calls with real durations, the session envelope. Filter by service.name = kiro-jarvis, search by session.id or tool.name to find specific interactions.
Because of the GenAI semantic conventions in the collector config, your traces also appear in CloudWatch’s GenAI Observability dashboard (under the AgentCore tab). This is the same span timeline UI used for production Bedrock agents — each tool call and skill load as a horizontal bar with start time, duration, and parent-child relationships. The dashboard adds session-level navigation: agent → session → trace → span.
The span timeline is good for spotting sequential tool calls that could be parallelized, or finding which phase of a multi-step skill is actually slow.
Once tool.name, duration_ms, and session.id are indexed (configure this in CloudWatch Transaction Search settings), you can build CloudWatch metrics and alarms:
- p95 tool latency by tool name — which MCP servers are slow?
- Tool calls per session — is the agent getting chattier after a skill change?
- Skill activation frequency — which skills actually fire vs. dead weight?
- Error rate by tool — which integrations are flaky?
- Session duration distribution — are users waiting too long?
A waterfall tells you what happened once. A dashboard over hundreds of sessions tells you whether your last skill edit made things better or worse.
Takeaways
If you’re building agents and not tracing them, you don’t know which tools are slow, which skills activate when they shouldn’t, or how many calls your agent makes per turn. Logs tell you what happened. Traces tell you what happened, in what order, for how long, and in the context of what came before.
The stack is simple: a bash script, a local OTEL collector, CloudWatch. No sidecar containers, no extra services. ~50ms overhead per tool call, mostly the curl to localhost. As of this writing, Kiro’s built-in telemetry publishes aggregate metrics (invocation counts, tool usage) but doesn’t produce per-session traces with span relationships — this fills that gap.
Once skills are named spans in a waterfall, you can A/B test skill changes by comparing traces. “Did the new version of my research skill reduce total tool calls from 6 to 3?” The waterfall shows it. The dashboard tracks it over time.
Previously: Optimizing multi-agent systems covered the OTEL stack for production multi-agent architectures. This post applies the same principles to your local development agent.